
A design company created test sites full of super-annoying issues, such as slow load times, auto-play music, and pop-ups, then measured how much each increased people's blood pressure.
One more note in advance: For more background & details about the number 1 killer in the website visitor experience, check out our blog.
It’s a devil’s bargain to be a tech tester. Sure, you get to see the latest and greatest things, but you also are essentially being digitally poked and prodded to measure everything. This new study by Cyber Duck UX Agency out of the UK went further with digital torture to measure stress levels.
Participants were placed in front of a website designed (by Cyber Duck) to be filled with some of the worst user experience (UX) elements we encounter online. Images not loading, weird animations, and buttons that don’t work were just a few of the 10 categories.
Each category of web torture had 110 participants, so 1,100 people aged 20 to 58 total were part of the study altogether. Researchers measured each person’s systolic blood pressure (the amount of pressure in arteries during heart contraction) as the participant used one of three of the custom-built sites. Normal blood pressure measures at 90 to 120, elevated is 121 to 129, and hypertensive stage one is 130 to 139. After that, you’re in the high BP category; higher than 180, you’re in crisis. No participant had any known health conditions; they also didn’t have any IT or web UX background.
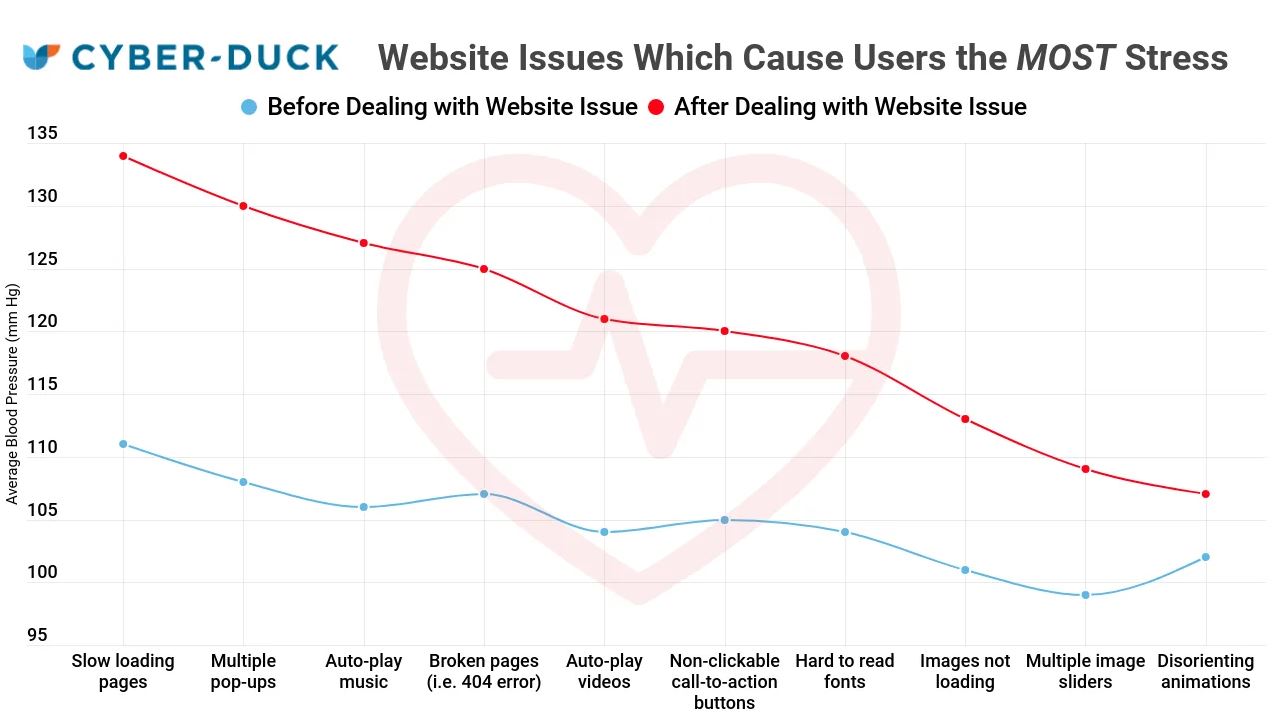
The results speak for themselves and indicate exactly what you should not do in any website design. The chart above shows the offenders, with the items on the left being the worst. Slow-loading pages (taking 8.8 to 10.5 seconds to fully load) caused a 21% spike in blood pressure, while multiple pop-ups and auto-play music were almost as bad, causing a 20% increase each. Items such as 404 broken pages and non-clickable buttons were just middling annoyances in comparison.
Other problems include multiple image sliders—so slideshow carousels weren’t that bad, huh?—causing a 10% increase in blood pressure and disorienting animations at a mere 5% increase.
So clearly, if you want to murder someone, find them the slowest webpage full of pop-ups and make them surf.
For an interactive version of the chart above, see below. You can blow it up to full-screen size for easier reading, to spare yourself a little stress.
Source: https://sea.pcmag.com/news/40981/study-finds-bad-web-design-is-killing-us-all-with-stress
Hint: We recommend all website owners to follow these advise.
Listed here again as a reminder:

- Slow loading pages
- Multiple pop-ups
- Auto-play music
- Broken pages (i.e. 404 errors)
- Auto-play videos
- Non-clickable call-to-action buttons
- Hard to read fonts
- Images not loading
- Multiple image sliders
- Disorienting animations
Any question left? Please let me know.
Best,
Pak Kriss, Bali