
Or: What is Google PageSpeed Insights and what is Lighthouse?
Why have Google’s PageSpeed Insight scores changed so significantly lately, but not as you expected?
Or, who distracts you so much from what just to keep you busy? (This question is more familiar to the readers of Douglas Adams The Hitchhiker’s Guide to the Galaxy)
Let’s start with Google PageSpeed Insights years ago.
Google PageSpeed Insights was introduced to make the Internet better. Maybe Google found out a lot of webpages need improvement. At the time Google was right.
So, they invented a great toolset called PageSpeed.
At around the same time or later they indicated to the market: A good Google PageSpeed Score will have a better SERP, meaning your web site ranking will improve.
OK, this was a good deal!
So, we developed perfect web page setups over time to score 100%, even with fully blown WordPress webpages, including a lot of plugins.
Then in 2018 or 2019 things began to change from our perspective:
- We have seen on our test web sites that the Google PageSpeed Insights scores DO NOT improve any SERP. And yes, we operate our own web pages to test and to monitor Google SERP activities to check if they are in line with their claims.
- Pages with a score of 100% started to degrade until next to nothing over the time. Without any changes on the web page itself. These pages were still super quick in loading and render timing.
(I still remember we adjusted out internal KPIs to deliver good results for our customers: 2018 the web browsers OnLoad Event timing was around 2 seconds, 2019 it was already near to 1-2 seconds, and 2020 was planned to be below 1 second, but the 2020 number was hard to archive, but that’s another story to write.)
Since some of our customers regularly test their own webpage with the Google PageSpeed Insights tool they come back to us and ask: What is wrong with my web page?
At this time, we didn’t know, and there was no reason visible to us that explained why quick WordPress pages degraded so much.
We were looking closer and tests showed up:
1. Most of Google’s own web pages are not looking good on Google PageSpeed Insights at all
2. If we integrate e.g. Google Maps on a webpage, the Google PageSpeed Insights score is going down dramatically
3. We tested some larger players like Amazon, they have a pretty fast shopping site. But Google PageSpeed Insights Score was not good at all.
At this time we started to ask ourselves, what is this?
Just a quick re-cap from Wikipedia:
Google PageSpeed is a family of tools by Google Inc, designed to help a website’s performance optimizations.[1] It was introduced at Developer Conference in 2010.[2][3] There are four main components of PageSpeed family tools: PageSpeed Module, consisting of mod_pagespeed[4] for the Apache HTTP Server and ngx_pagespeed[5] for the Nginx[6], PageSpeed Insights, PageSpeed Service, and PageSpeed Chrome DevTools extension. All of these components are built to identify faults in a website’s compliance with Google’s Web Performance Best Practices, as well as automate the adjustment process.*
So Google PageSpeed Insights is all about a web site’s loading speed in terms of user experience: When the user sees the initial content. When the content is fully loaded and when the user can use/read etc the website.
So, at this time our diagnostic was: Google PageSpeed Insights is broken.
BTW We found out over the course of time by doing Google PageSpeed Insights related tasks and investigations, that our KPIs in terms of load and render timings was already (very) good and the right way to go.
Now, around 12 months later (or a few months more or less), nothing has improved with Google PageSpeed Insights Scoring. And some other new figures are introduced like “Cumulative Layout Shift” and it looks like all these numbers do not fit together. Or are we missing something?
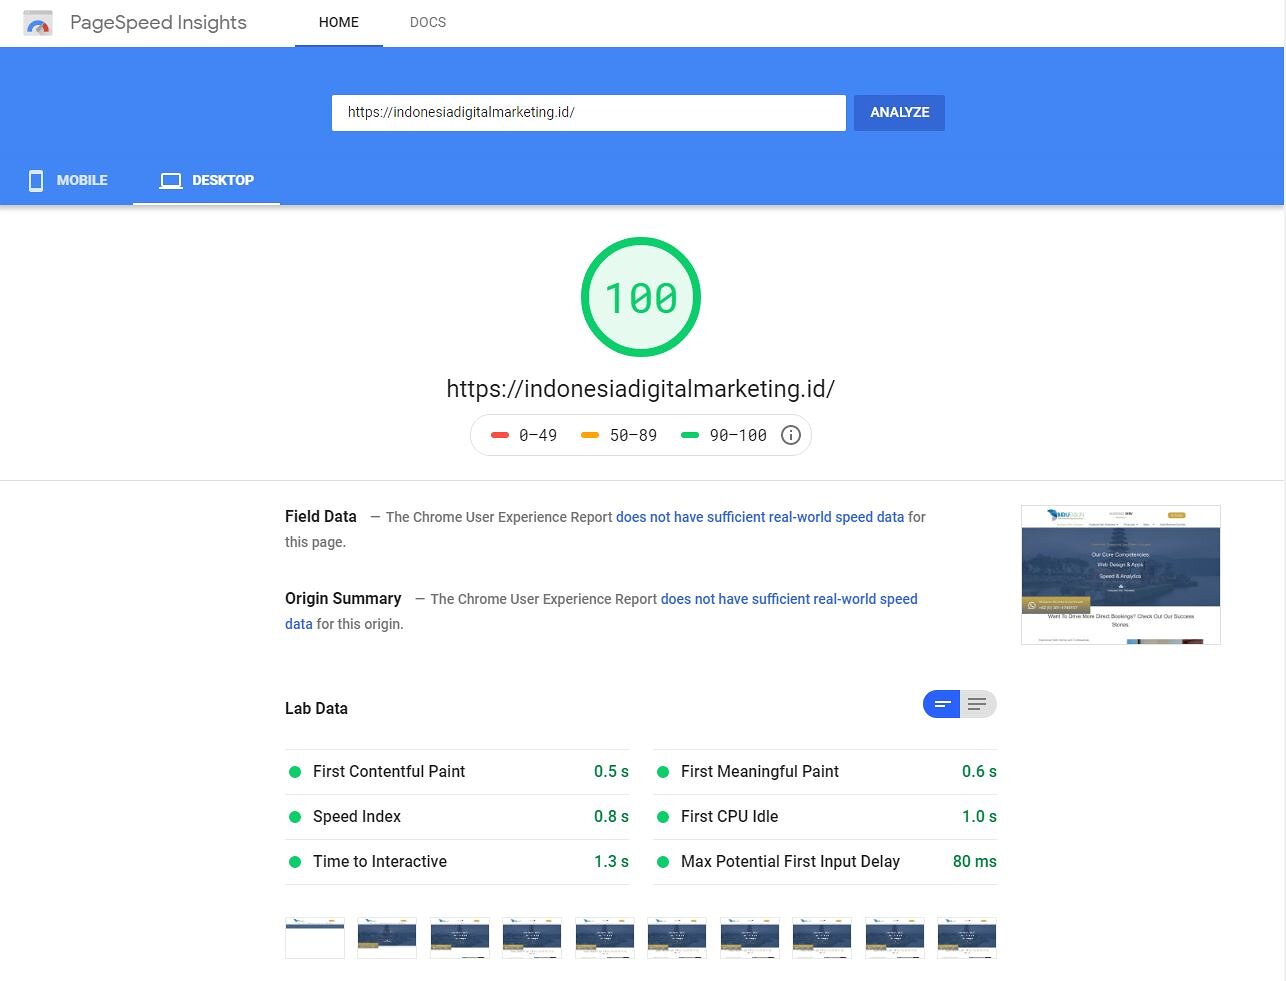
Here are some examples we ran this morning https://developers.google.com/speed/pagespeed/ with https://www.indonesia-digital-marketing.com/
PageSpeed Insights test results for mobile devices:
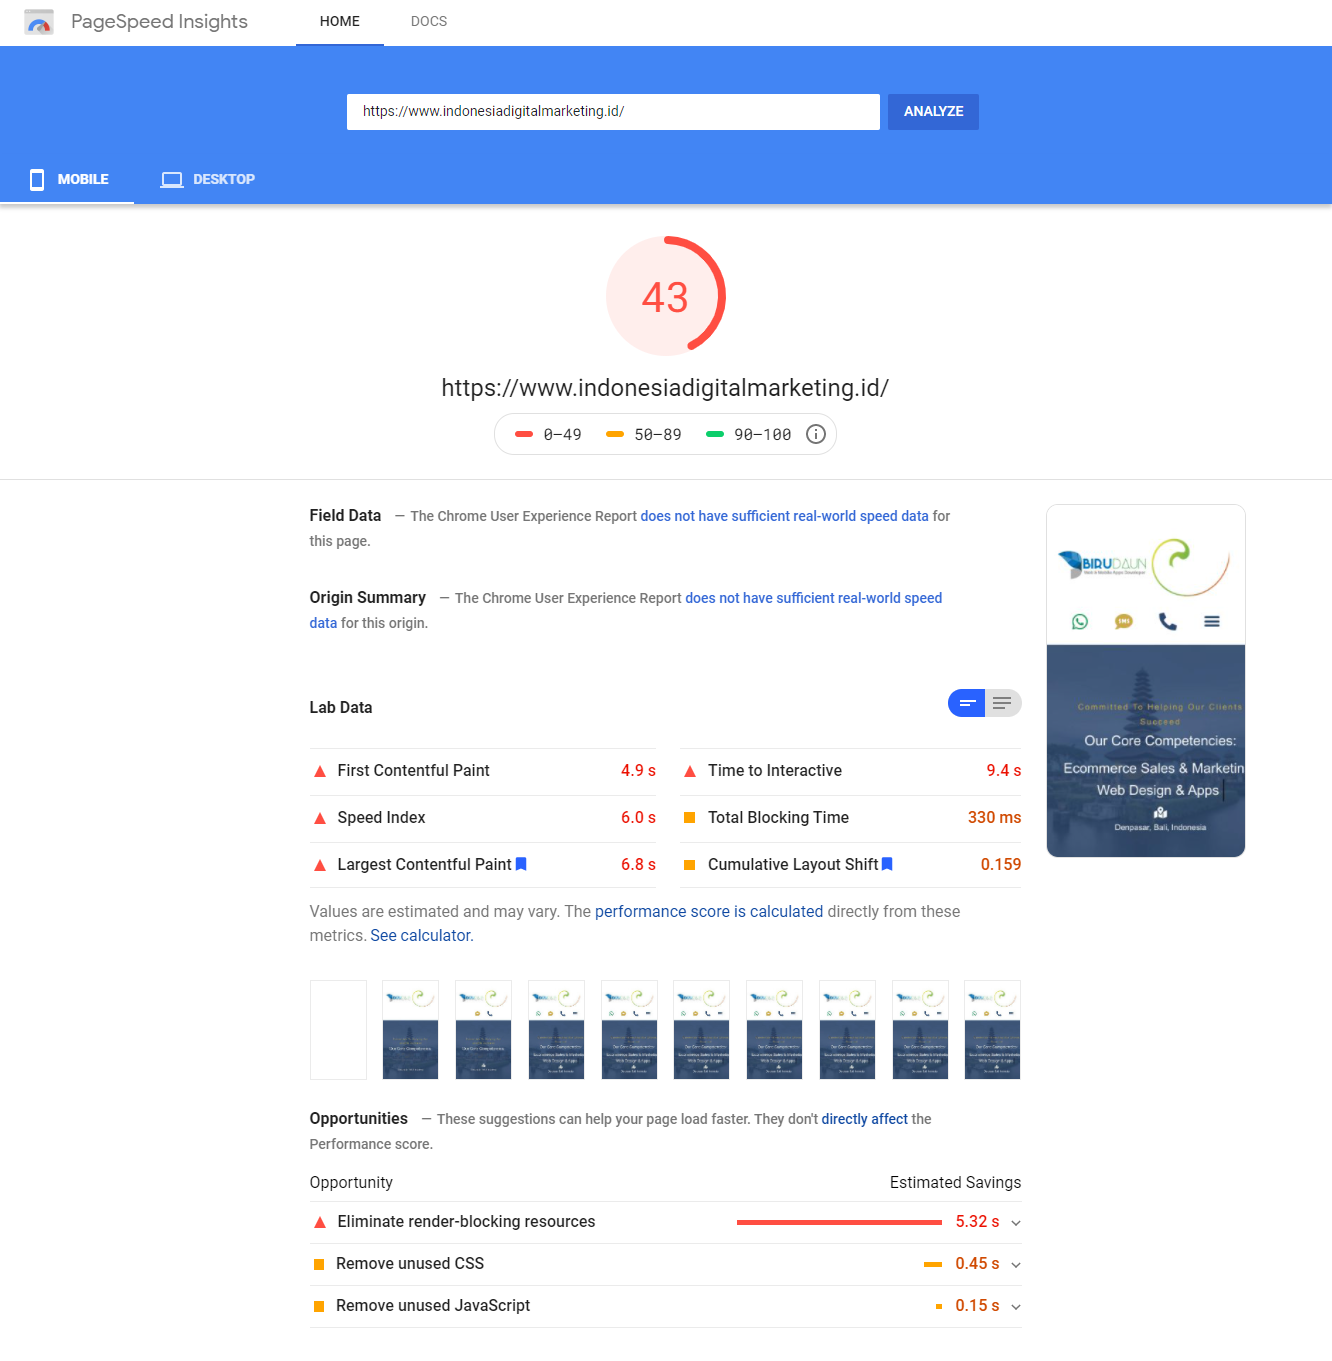
Let’s start like this: On the screenshot stripe you can see the test showed that the page mostly loaded and painted between 1-2 seconds, but the synthetic PageSpeed Insights reports: First Content Paint: 4.9 seconds. Wow. The time for the page to become interactive shows up 9.4 seconds. Double-wow. Largest Contentful Paint: 6.8 seconds. Now triple-wow. So far the opportunities that exist for us are: Eliminate render-blocking resources giving us an estimated savings: 5.32 seconds.
I have run out of Wows for the moment. So we can make time travel work for us.
Ok, next. Let’s check the test results for desktop:
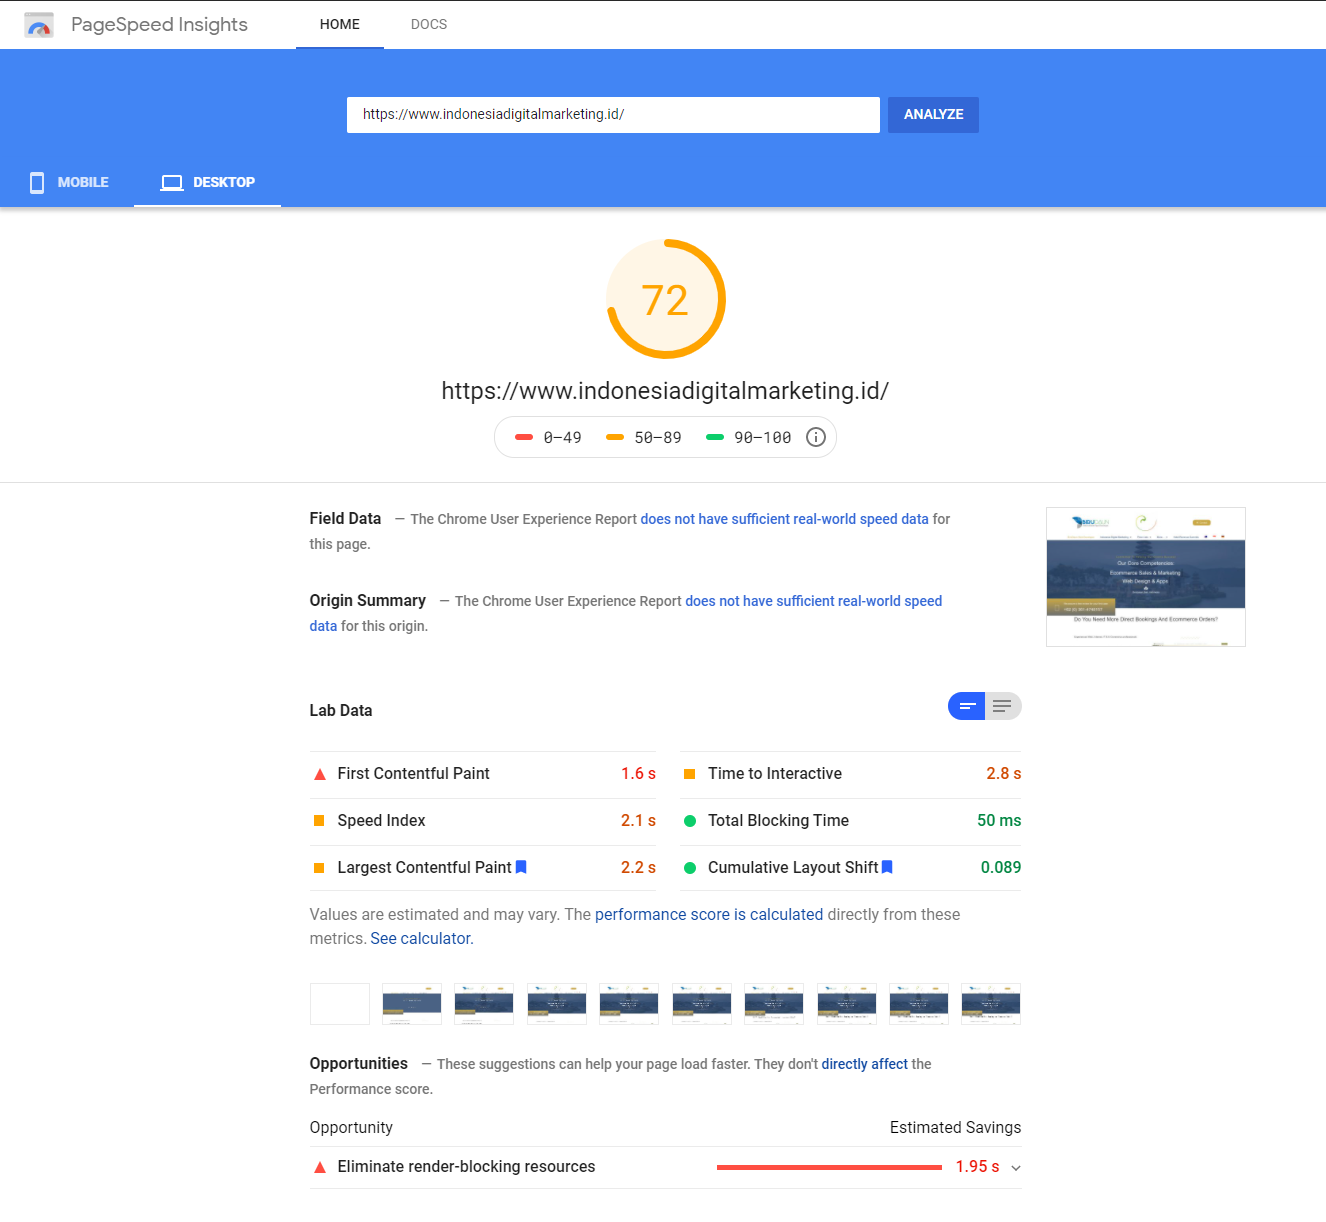
At the screenshot stripe, you can see the test shows the page is mostly loaded and painted between 0,5-1 second, but the synthetic PageSpeed Insights report says First Content Paint shows up in 1.6 seconds. Ok. Time to interactive show up: 2.8 seconds. Soso. Largest Contentful Paint: 2.2 seconds. Aha. Opportunities: Eliminate render-blocking resources -> estimated savings: 1.95 seconds. Yaya.
It’s not getting better.
This is all crap. And we know those guys can do better. But why don’t they? It’s a good question that can’t be ignored any longer.
For the time being we are continuing to identify the best solutions for ourselves and our clients and will continue to update you.
Time travel very briefly explained: With the help of Google PageSpeed Insights you can see on a mobile device that this website can be loaded approx. 3 to 6 seconds before the website is opened. Isn’t that super cool, is it? (The physical scientists and others may please forgive me for that)
So what then is going wrong? The bottom line: The synthetic Google PageSpeed Insights and real world (timing) numbers do not fit together anymore. And this we’ve seen this year all through 2020 until today.
What is Google doing? We do not know, but at least it keeps you guys busy.
Every day I see the questions arises in Facebook web developer groups: How can I get a better score? What do I have to do? The problem we see here is that the basics are simply not understood.
Since there are so many discrepancies in Google PageSpeed Insights and real word user monitoring and timing numbers we adjusted our testing to ensure best results for our customers.
Nowadays, while I write this brief, this synthetic tests like Google PageSpeed Insights or Google’s Lighthouse are of very limited help, and at the moment we do not recommend using it, except you are a professional and know how to read the different values and how to handle this. Right?
We use other tools and we basically run tests from overseas recording the visual activities of the web browser and check if 1) the different speeds involved are low and 2) does the visual load, render and final result look good to a human in terms of visual changes 3) loading content on our own devices to judge the quality and load times for ourselves.
That’s it, basically.
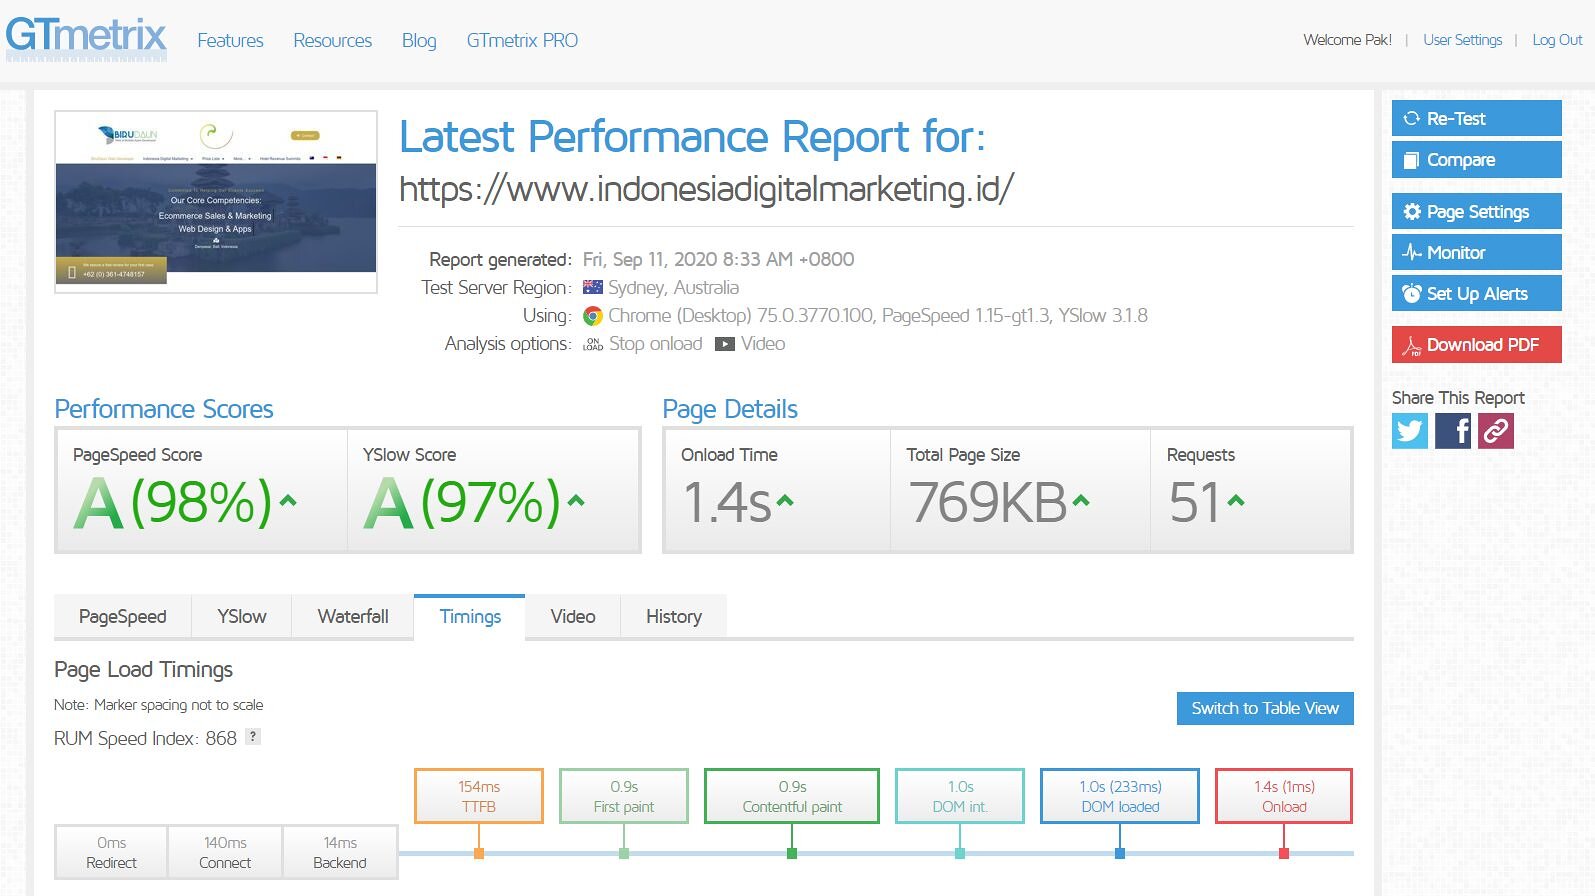
What does this look like? Here, let’s have a quick view of how the tests looked this morning:
Look at the “Page Load Timings” squares below, here tested from Australia (GTmetrix). We run this kind of test 3-5 times to see if results are stable or not.
Here is a real world visual recording for a mobile device within the Indonesian XL mobil network (Click to play it):
Here is the visual recording for desktop from GTmetrix (Click to play it):
As you can see we are within our own defined KPIs and we can ensure the page is loaded quickly and nicely around the world, which is very important for any kind of business where you pay or get paid by clicks or visitors, like in the area of Digital Marketing or you have mid- to high-volume of visitors and need conversions.
Bottom line in a brief message to our paying customers: All is good and we are constantly monitoring your website to ensure best load times and quality.
Any questions? Please let me know.
Best,
Pak Kriss
FAQ:
- Do you still you use Google PageSpeed Insights for you daily work?
Sometimes for quick look. We work regular with Chrome DevTools. - What is “Largest Contentful Paint“ and other technical terms?
Please look at the reference section. - What tools you use nowadays to check performance?
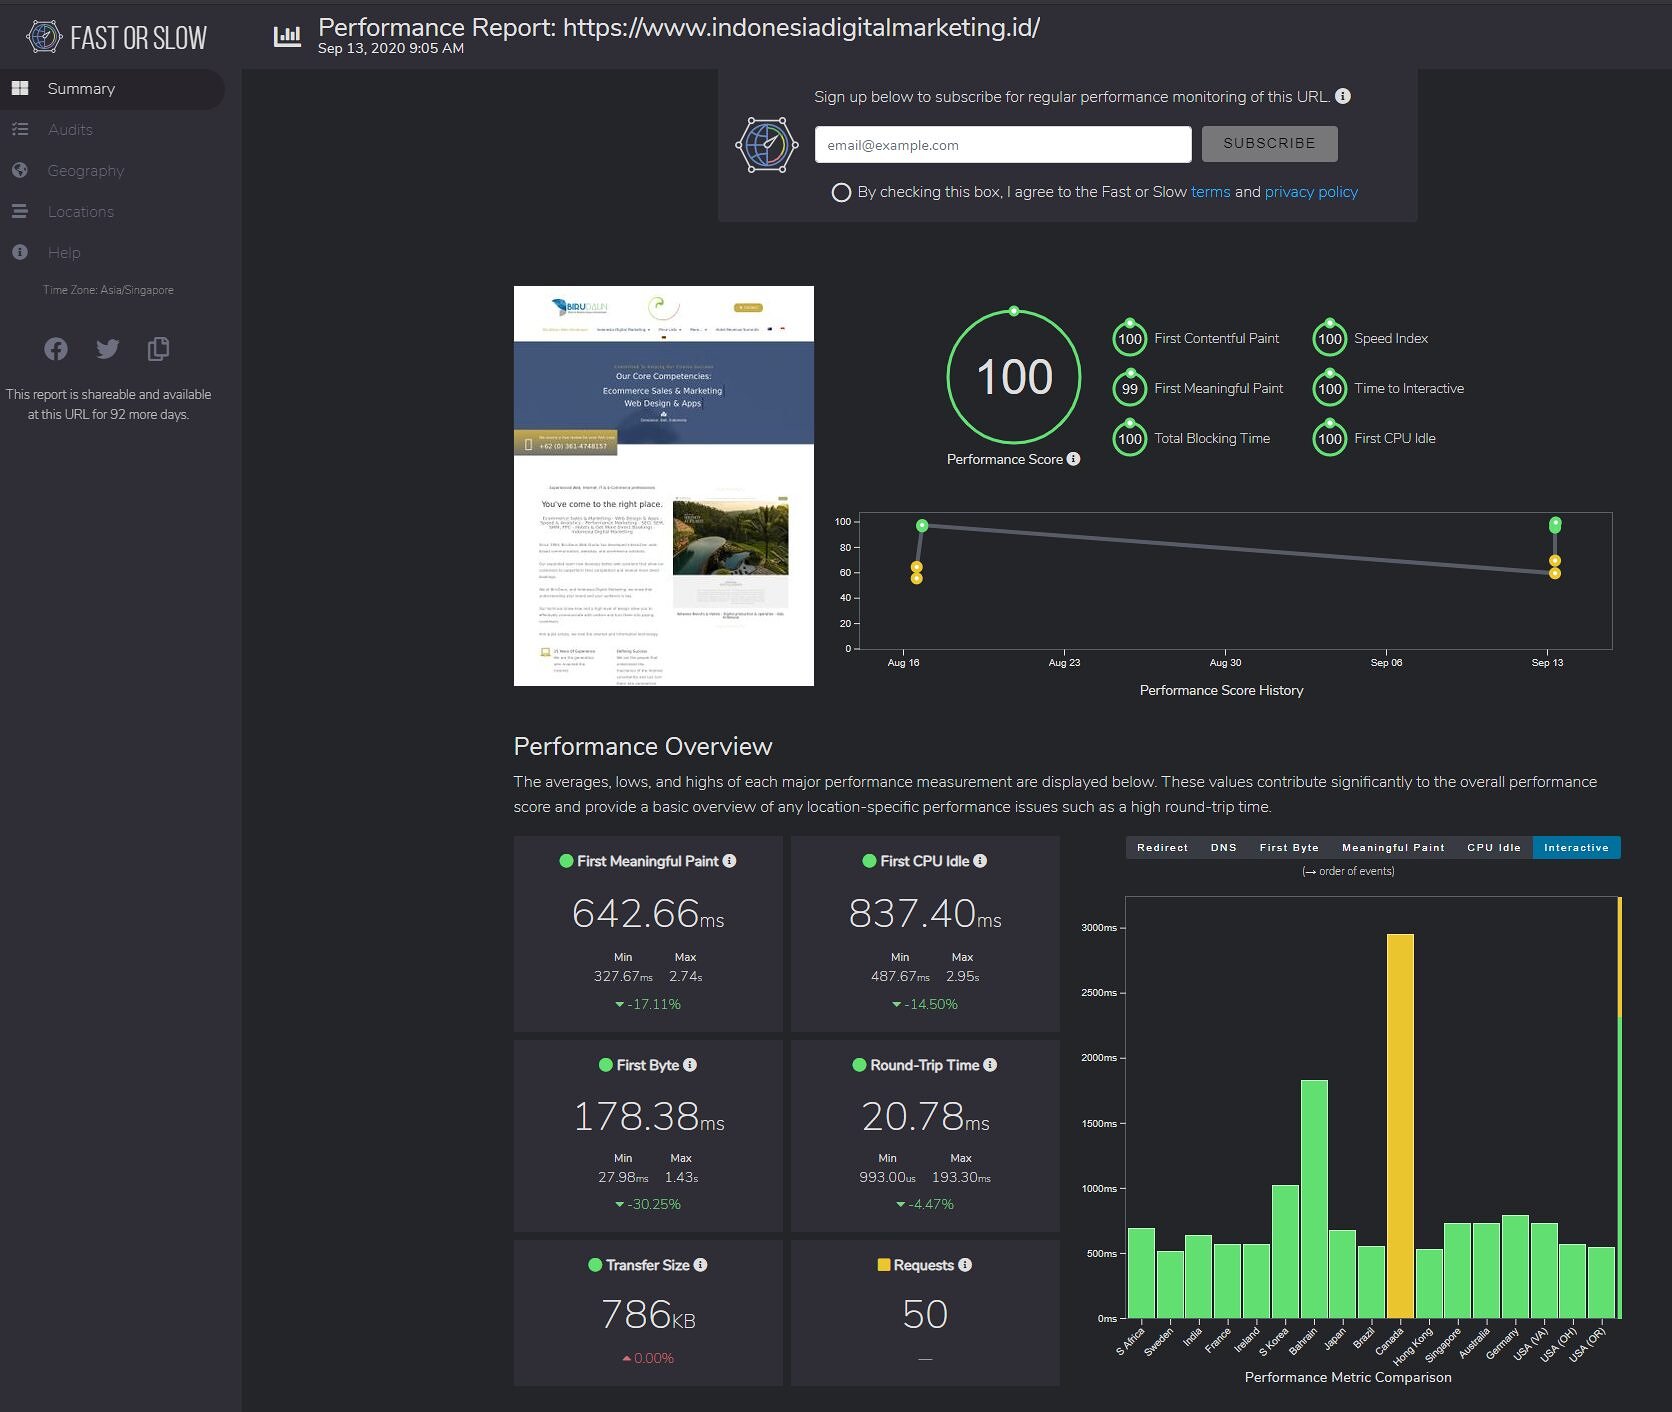
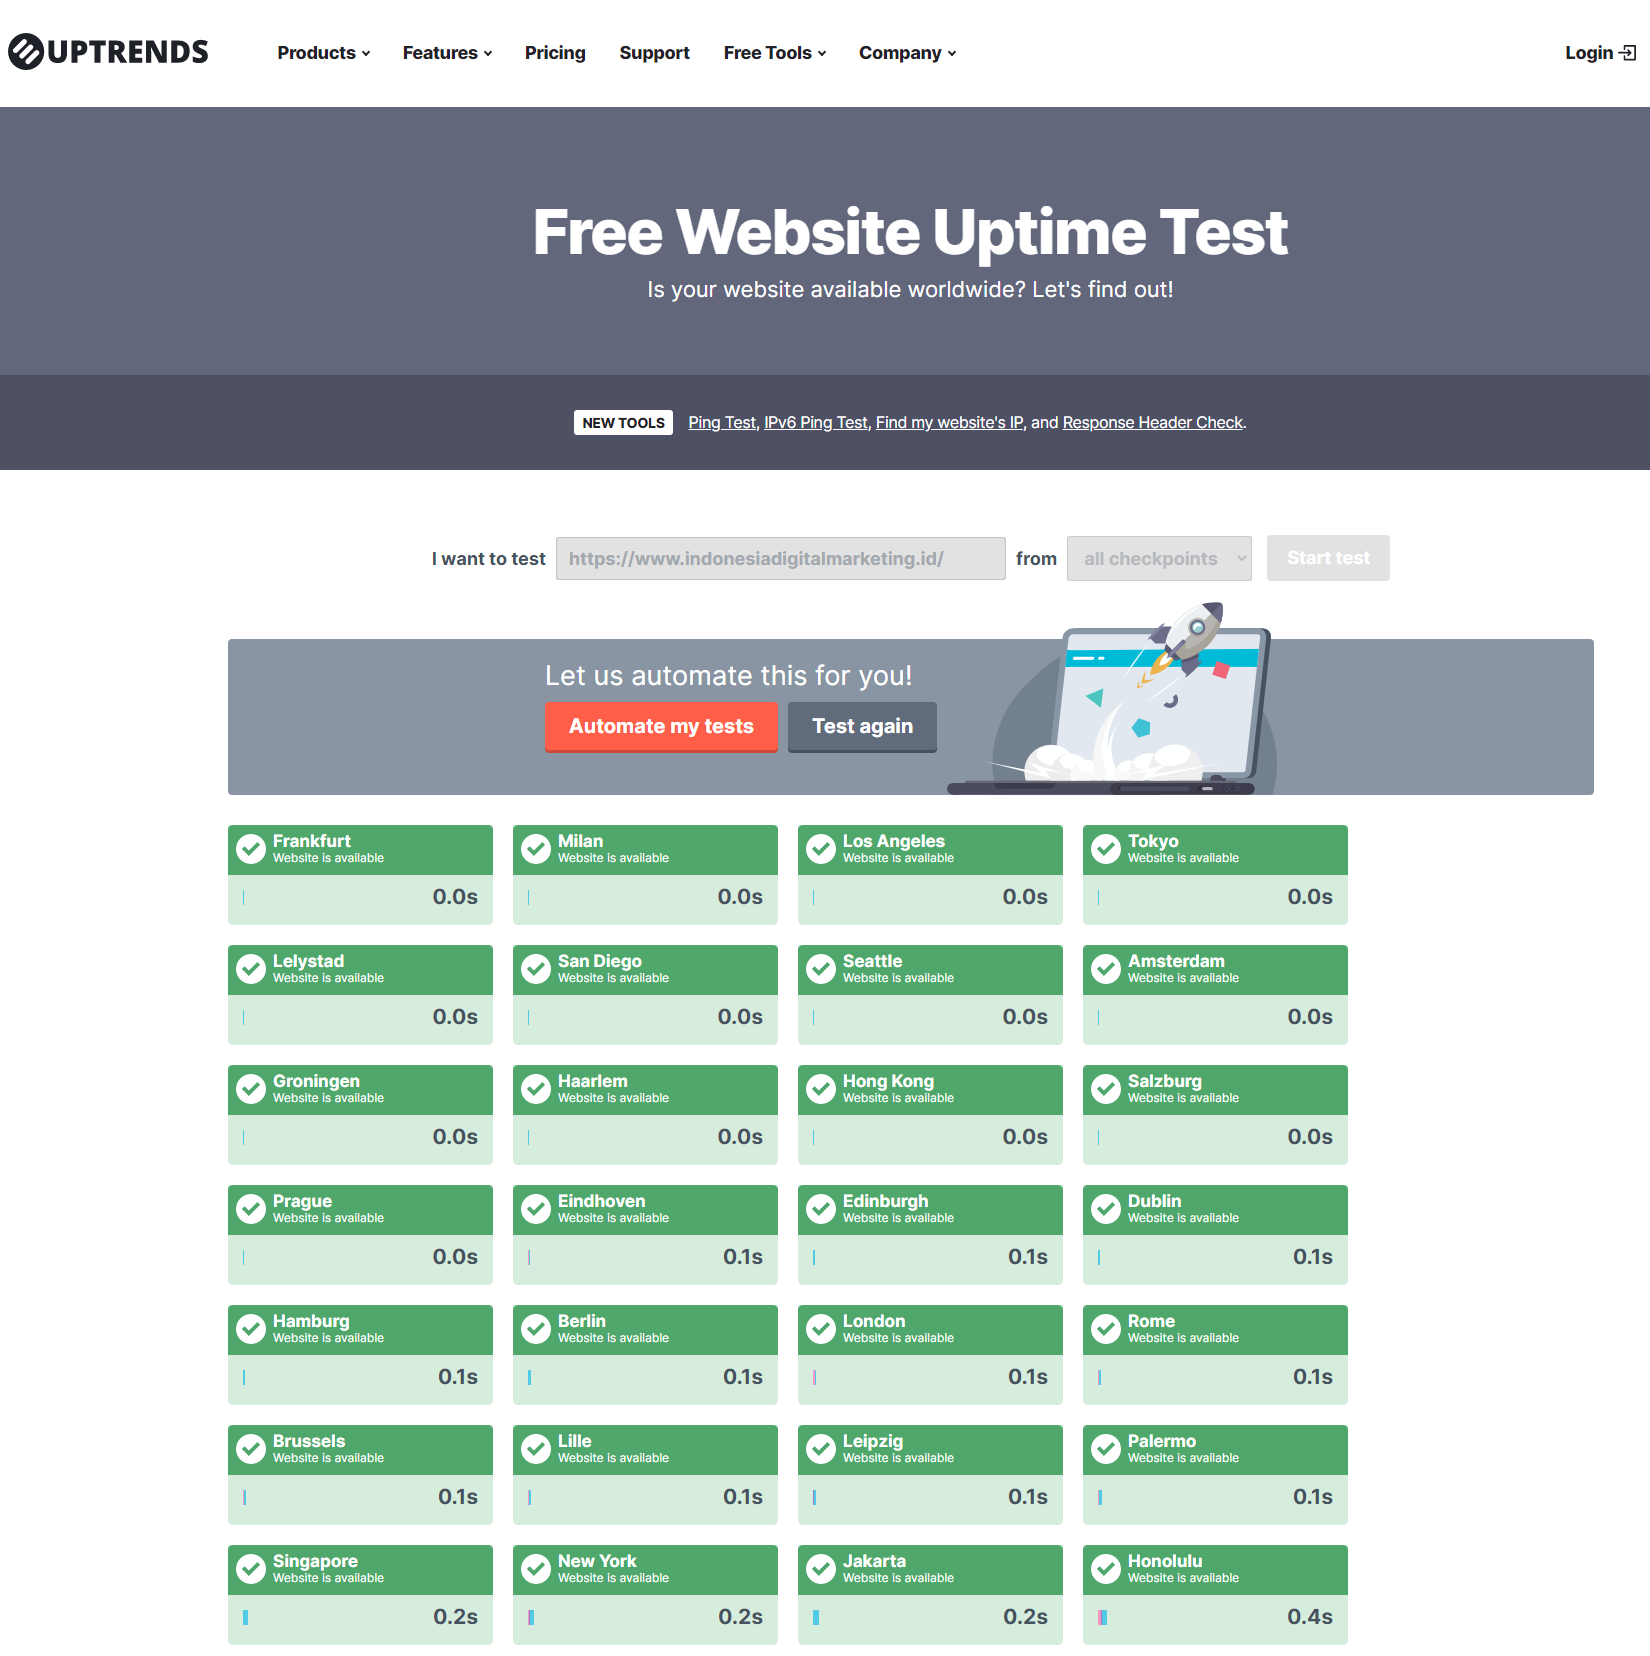
e.g. https://gtmetrix.com/ or https://www.fastorslow.com/ or https://www.uptrends.com/tools/uptime or https://www.uptrends.com/tools/website-speed-test or very limited https://www.webpagetest.org/ since their Jakarta origin is not reliable.
References:
- First Content Paint – First Contentful Paint (FCP) is one of six metrics tracked in the Performance section of the Lighthouse report. Each metric captures some aspect of page load speed. https://web.dev/first-contentful-paint/
- Largest Contentful Paint – The Largest Contentful Paint (LCP) metric reports the render time of the largest image or text block visible within the viewport. https://web.dev/lcp/
- render-blocking – The Opportunities section of your Lighthouse report lists all URLs blocking the first paint of your page. The goal is to reduce the impact of these render-blocking URLs by inlining critical resources, deferring non-critical resources, and removing anything unused. https://web.dev/render-blocking-resources/
- Time to interactive – Measuring TTI is important because some sites optimize content visibility at the expense of interactivity. This can create a frustrating user experience: the site appears to be ready, but when the user tries to interact with it, nothing happens. https://web.dev/interactive/
- KPIs – https://en.wikipedia.org/wiki/Performance_indicator
- Google PageSpeed Insights – https://developers.google.com/speed/pagespeed/insights/ and https://developers.google.com/speed
- Lighthouse – Lighthouse is an open-source, automated tool for improving the quality of web pages. You can run it against any web page, public or requiring authentication. It has audits for performance, accessibility, progressive web apps, SEO and more. https://developers.google.com/web/tools/lighthouse
- SERP – https://en.wikipedia.org/wiki/Search_engine_results_page
- WebDev Tools – Chrome DevTools is a set of web developer tools built directly into the Google Chrome browser. DevTools can help you edit pages on-the-fly and diagnose problems quickly, which ultimately helps you build better websites, faster. https://developers.google.com/web/tools/chrome-devtools
- OnLoad Event – The load event fires at the end of the document loading process. At this point, all of the objects in the document are in the DOM, and all the images, scripts, links and sub-frames have finished loading. https://developer.mozilla.org/en-US/docs/Web/API/GlobalEventHandlers/onload